Understanding IR Spectrum Chart: A Quick Guide

Infrared (IR) spectroscopy is a powerful tool used in chemistry to identify and analyze the structure of molecules. Understanding an IR spectrum chart is essential for researchers, students, and professionals in fields like organic chemistry, pharmacology, and material science. This guide will walk you through the basics of interpreting IR spectra, making it easier to identify functional groups and understand molecular vibrations. Whether you're a beginner or looking to refresh your knowledge, this post will provide valuable insights into mastering IR spectroscopy.
What is an IR Spectrum Chart?

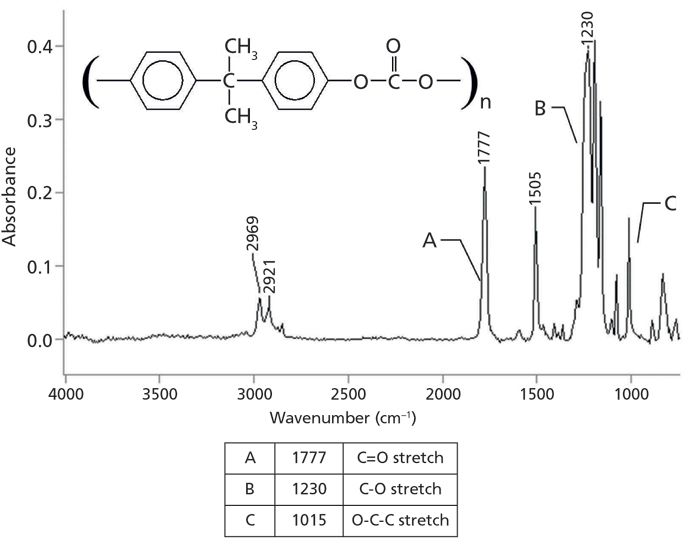
An IR spectrum chart is a graphical representation of how a molecule absorbs infrared light at different wavelengths. The x-axis typically represents the wavenumber (in cm-1), while the y-axis shows the percent transmittance or absorbance. Key regions of the spectrum include the functional group region (4000–1500 cm-1) and the fingerprint region (1500–400 cm-1). Understanding these regions is crucial for identifying specific functional groups in a molecule.
Key Components of an IR Spectrum

To effectively interpret an IR spectrum chart, familiarize yourself with its main components:
- Wavenumber (cm-1): Indicates the energy of the absorbed IR radiation.
- Percent Transmittance/Absorbance: Shows how much light passes through the sample or is absorbed by it.
- Peaks: Represent specific molecular vibrations, such as stretching or bending of bonds.
📌 Note: Higher wavenumbers correspond to higher energy transitions, typically associated with stronger bonds.
How to Interpret an IR Spectrum Chart

Interpreting an IR spectrum chart involves identifying peaks and correlating them with functional groups. Here’s a step-by-step approach:
- Identify the Region: Determine if the peak falls in the functional group or fingerprint region.
- Match Peaks to Functional Groups: Use reference tables to match peak wavenumbers to specific functional groups (e.g., O-H stretch at 3200–3600 cm-1).
- Analyze the Fingerprint Region: This region provides a unique “fingerprint” for the molecule, aiding in its identification.
| Functional Group | Wavenumber (cm-1) |
|---|---|
| O-H stretch (alcohol) | 3200–3600 |
| C=O stretch (ketone) | 1700–1750 |
| C-H stretch (alkane) | 2850–3000 |

Tips for Mastering IR Spectroscopy

To become proficient in reading IR spectrum charts, consider the following tips:
- Practice Regularly: Analyze various spectra to improve your skills.
- Use Reference Materials: Keep a reliable IR spectroscopy reference guide handy.
- Compare Spectra: Compare unknown spectra with known compounds for better identification.
Mastering the IR spectrum chart is a valuable skill for anyone working with molecular analysis. By understanding its key components, interpreting peaks, and practicing regularly, you can confidently identify functional groups and analyze molecular structures. Remember, consistency and the use of reference materials are key to becoming proficient in IR spectroscopy.
What is the functional group region in an IR spectrum?
+The functional group region (4000–1500 cm-1) contains peaks that correspond to specific functional groups, such as O-H, C=O, and C-H stretches.
How do I identify an unknown compound using IR spectroscopy?
+Compare the peaks in the unknown compound's IR spectrum with those of known compounds or use reference tables to match functional groups.
What is the fingerprint region in an IR spectrum?
+The fingerprint region (1500–400 cm-1) provides a unique pattern of peaks that can be used to identify specific molecules.
IR spectroscopy, functional groups, molecular vibrations, wavenumber, percent transmittance, IR spectrum interpretation, infrared spectroscopy basics, IR spectrum analysis, IR spectrum tutorial, IR spectrum guide.


